
A Bayesian approach to estimate the effect of a content and a weekday on the post published on a Facebook page
- I assume a reader has knowledge of Bayesian statistics
- Sample code is here
Today, social media has become an interactive platform, where customers can exchange ideas and leave reviews about products. Based on marketing statistics, adults aged 18-34 are most likely to follow their favorite brand using social media (95%). As a result, these adults become potential customers and a good target for the industry giants. Almost every popular brand uses this tool “for granted” because it is:
- convenient
- cheap
- one of the effective and easy ways to advertise a product. For instance, more than 50 million small businesses use Facebook Pages to connect with its potential customers
Impressed with the brand’s new post about product followers of that page tend to “interact” with that post by “liking”, leaving comments and sharing the post with their connections. The total number of interactions can serve as a good indicator of post impact. There might be a tremendous impact or no impact at all. Also, the extent of impact may depend on other factors such a weekday on which post was published, its content, etc. It is our goal to help business owners make smarter decisions with Facebook ads by identifying whether there is an effect of a content or a week day on the number of total interactions with that post. To this end, we developed a hierarchical conditionally autoregressive (CAR) model which takes into consideration time dependence
We used the dataset related to posts published during the year 2014 on Facebook’s page of a renowned cosmetics brand.

For the analysis, we chose “Total Interactions” as a primary response variable, defined as:
(1) Total interactions = (# of likes + # of comments + # of shares)
To model the post impact, we selected categorical variables “Type” and “Post weekday”. Here, “Type” categorizes post into link, photo, status, and video. All of these metrics are known prior post publication. The “Post weekday” indicates on which day of week post was published.
For starters, descriptive analysis shows that, on average, Facebook users interacted with the video post the most while links were clicked least. As histogram shows, the distribution of “Total Interactions” is highly skewed to the right.
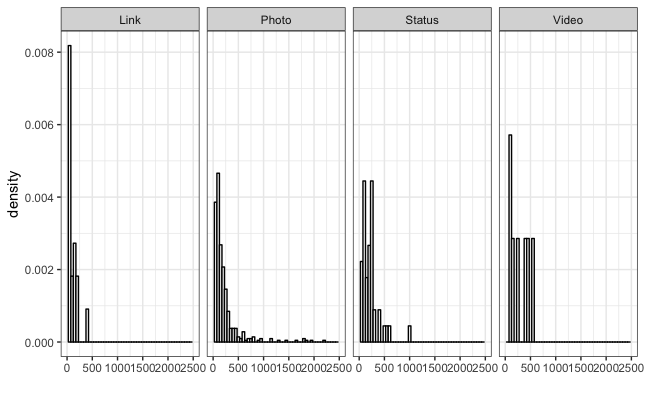
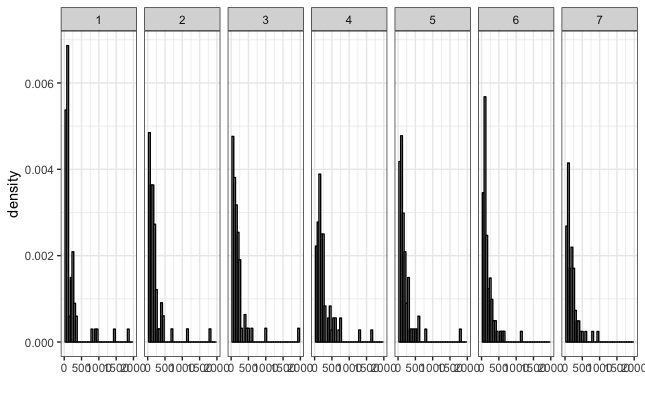
Since the model expects normally distributed data, we log-transformed the response variable (by adding a small constant) to obtain normally distributed-ish data.
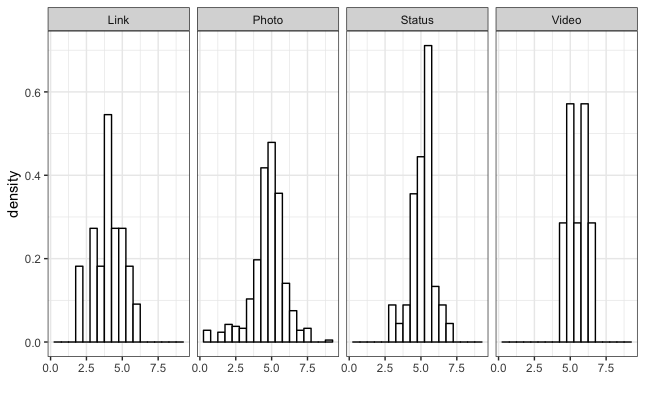
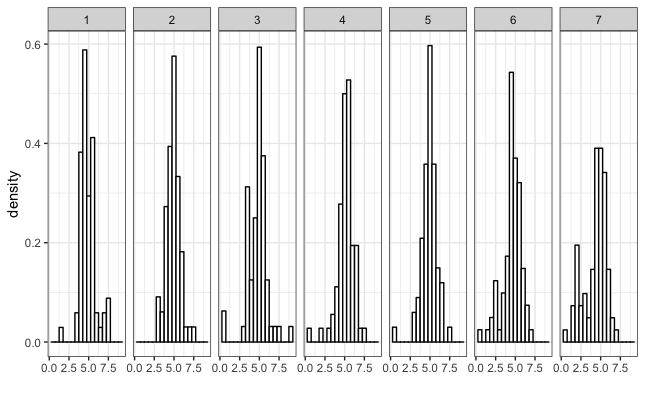
For the future reference of log-transformed “Total Interactions”, use following:
(2) y = log(Total Interactions)
Post impact can be measured by the number of total interactions along with the content and week day on which the post was published. Since the variable “weekday” is neighborhood dependent, it is assumed to have a spatial random effect on y. Another categorical variable “type” is assumed to have a fixed effect on y. Therefore, we add CAR model and the linear trend terms to the final model. For all “type” and “weekday” combinations, we will calculate posterior probabilities of whether, for a given combination, marginal mean is higher than those of others:
![]()
for j = {1, 2, …, n}/{i}, where n = # of “type” and “weekday” combinations. Also, posterior distributions of fixed and random effect parameters will help us to answer the problem statement question.
Model
For the model of interest, let yi be the value for the ith post. Let i, ranging from 1 to 500, be the post published on a particular day with the particular content. We assume that yi are distributed independently. Then, for a given post, i = {1, 2, 3, …}:
![]()
where the mean is defined as:
![]()
where the effect of days is defined as:


Furthemore, you can see how we defined prior for the model:
![]()
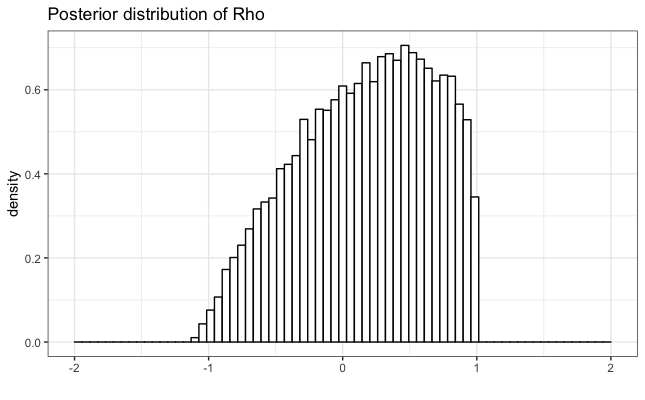
Let’s break this down. First, as a diffuse prior for the standard deviation, 𝜎, we chose half Cauchy prior with positive support. Second, we selected uniform priors over the real line on all fixed effect parameters 𝛽 = [𝛽1, 𝛽2, 𝛽3, 𝛽4]. 𝛽’s uniform priors have sufficient coverage over the possible values of the linear trend term, both negative and positive trends. Finally, 𝜌, a paramater of CAR model, is assumed to have uniform distribution constrained by the eigenvalues of
![]()
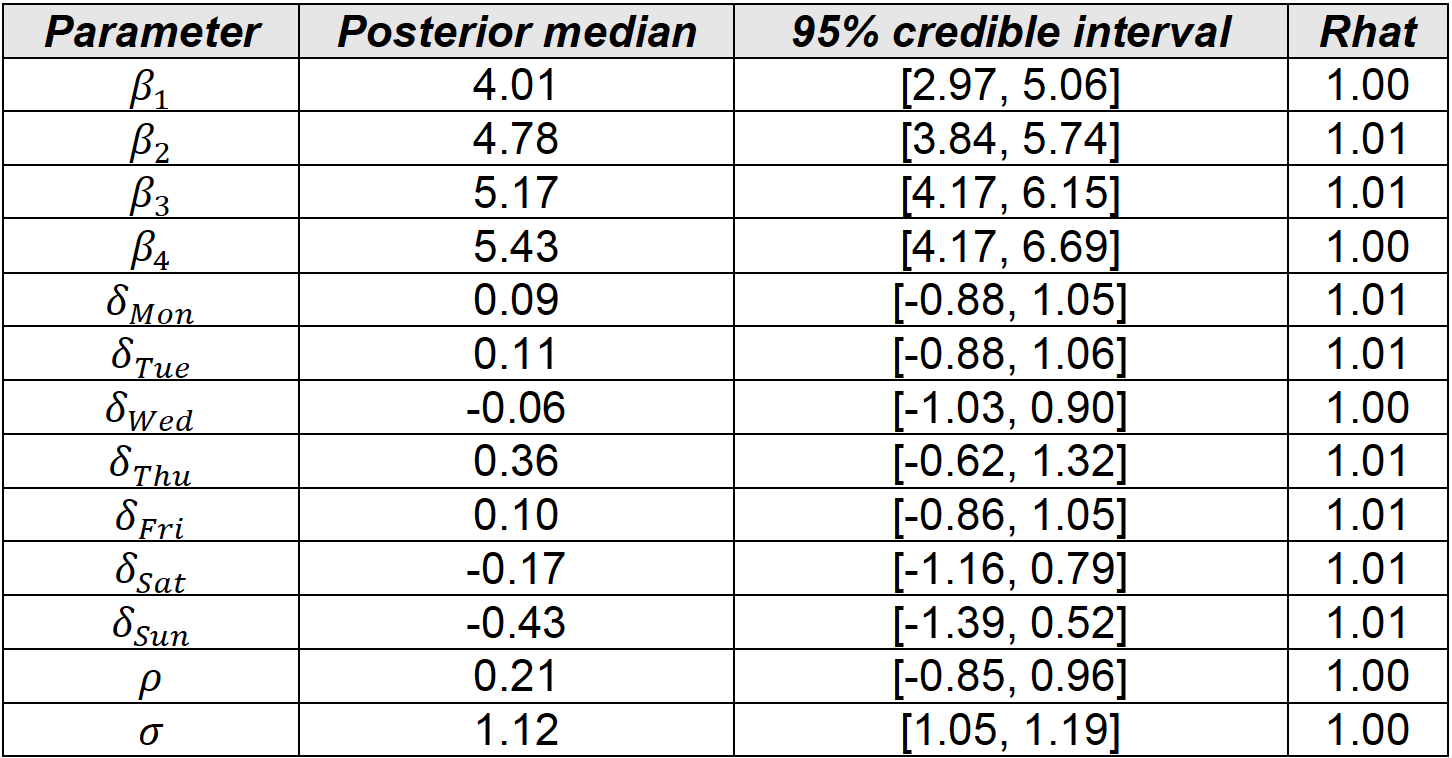
We used Stan with R package “rstan” to generate samples from the posterior distribution of the parameters. A 4 chains MCMC was employed with 10000 iterations in total and 5000 burn-in iterations (We’ll discuss MCMC in the next post). We ended up with 20000 MCMC samples generated for 𝜌 , 𝛽 , 𝛿 and 𝜎 parameters. The potential scale reduction factor on split chains are given below. Note that Rhat = 1 for all parameters, meaning that MCMC converged normally.
Results
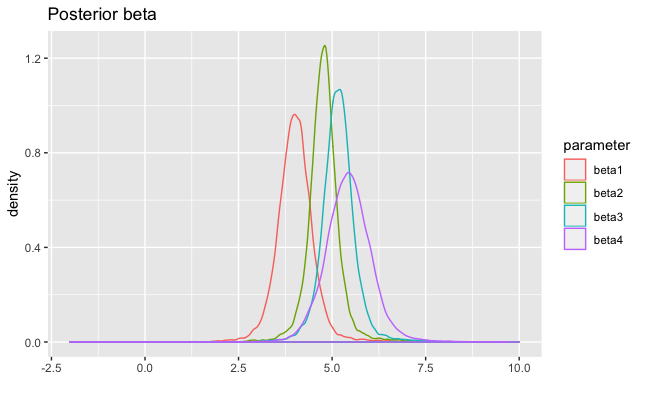
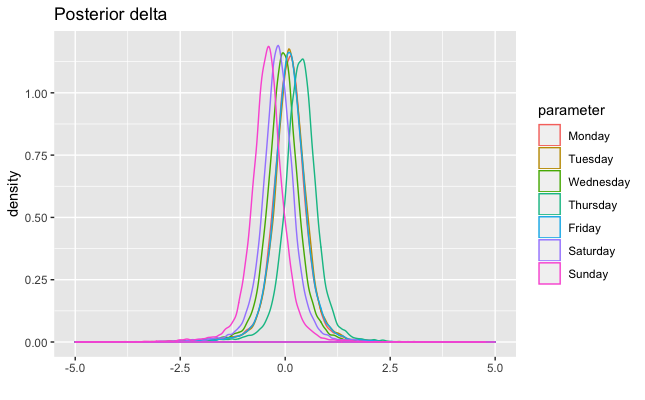
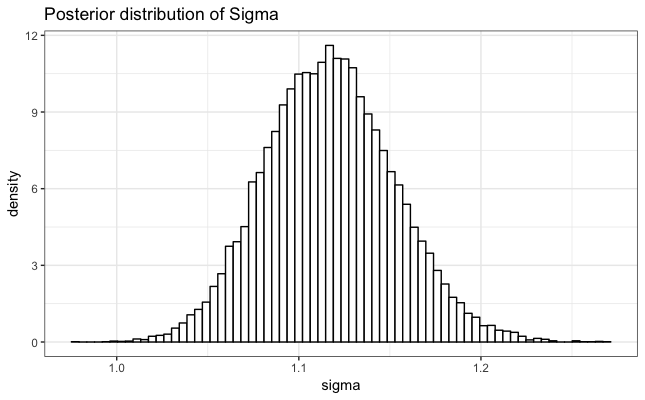
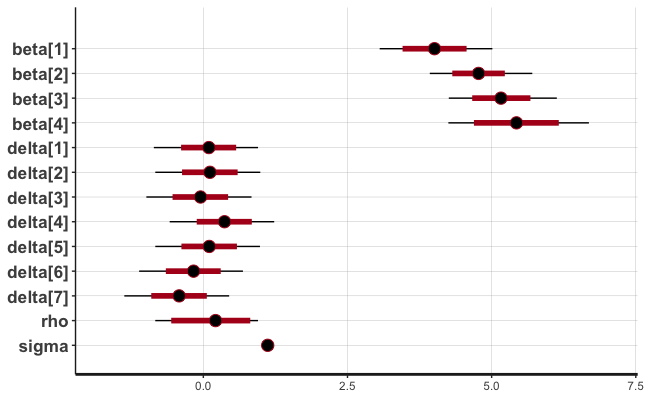
In the previos table, you also can see posterior medians and 95% credible intervals for each parameter. Furthemore, below, you can find posterior distributions of 𝛽, 𝛿, 𝜌, and 𝜎 parameters.
Using resulting posteriors of 𝛽 and 𝛿 parameters, and equation for 𝜇𝑖, we calculated posteriors of 𝜇𝑖. After that, we determined marginal posterior medians and 95% credible intervals for each 𝜇𝑖.
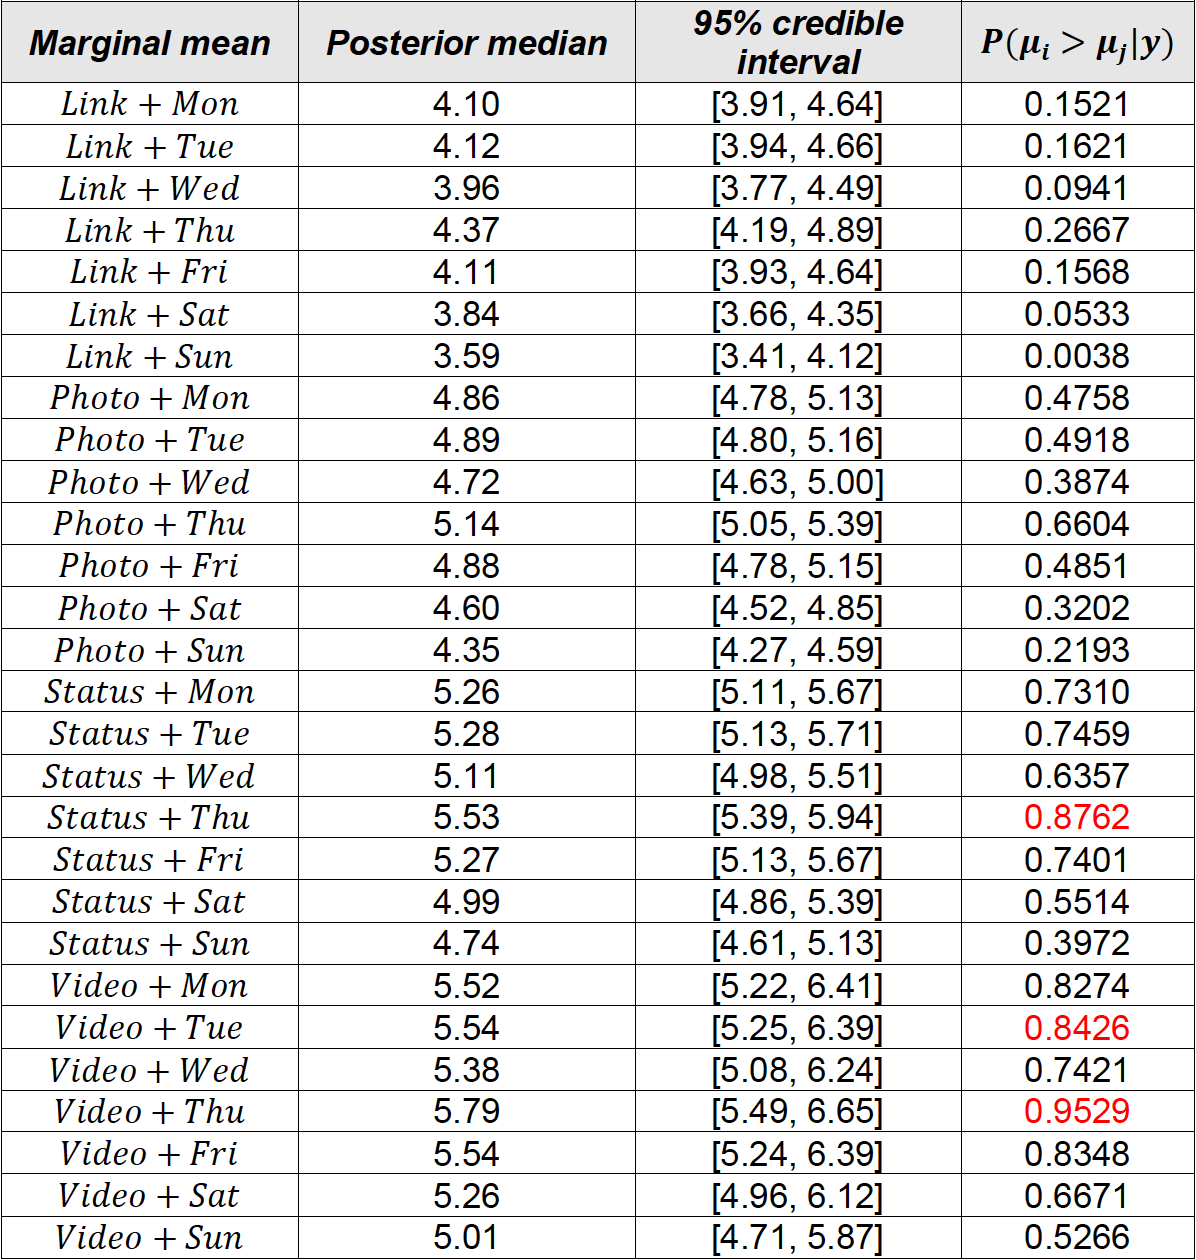
Our goal is to identify whether there is an effect of the content of a post or the day it was published on the number of total interactions that post collects.
To answer the posed question, we found the posterior probability whether, for a given type + weekday, its marginal mean is higher than those of others (see previos table). The video + thursday combination has the highest posterior marginal mean of 0.9529. This means a post has higher impact if it’s a video published on Thursday. Posterior of 𝛿𝑇ℎ𝑢 has greater values than other days, while posterior of 𝛿𝑆𝑢𝑛 has the smaller values. Credible intervals for 𝛿 are tight and around zero, slightly moving to the left after Thursday.
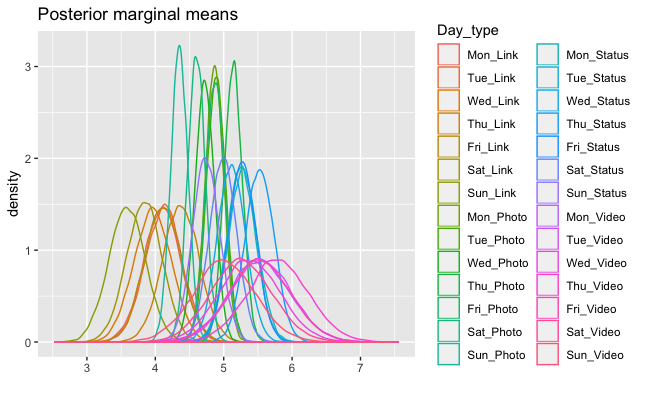
The following figure shows videos, on average, have higher number of total interactions. Status and photo posts collect almost similar interactions. As expected, link posts have smallest number of total interactions.
This analysis can be extended further by including “type” and “weekday” interactions in the model.